It has been right around 6 months since I last wrote about the state of the open source projects hosted by the Foundation and I figured it was high time to revisit the topic and share a mid-year update. In January’s post, I concluded with a teaser of some work that, at that time, was just getting under way:
“We are currently investigating what it would take to provide soft real-time metrics (initially for projects) to project teams, the community, the ESCo and ultimately, the Foundation Board, and have identified a number of intriguing solutions in this space.”
After several months of implementation work and beta testing with my Foundation colleagues and the Foundation’s Engineering Steering Committee (ESCo), I was very pleased to announce the general availability of this system at the annual member’s meeting late last month.
The system is now publicly available at https://metrics.symphony.foundation/, with usage instructions on the wiki. Feedback welcome!
The new system is based on technology provided by Bitergia, an open source startup that began life in academia; specifically from research conducted by Jesus M. Gonzalez-Barahona and his graduate students at the Universidad Rey Juan Carlos in Madrid. Not only did the Bitergia system impress me functionally, I was pleased to see the Bitergia team’s commitment to open source - not only via their own open sourcing efforts, but also their participation in independent initiatives such as the Linux Foundation’s CHAOSS Metrics Committee.
The reason for leading with this news is that our Bitergia deployment has already become the go-to source for information on project activity within the Foundation, and in the coming months will increasingly become the primary source for Working Group activity as well. The ESCo is already monitoring these metrics to support their technical steering responsibilities and to help craft their quarterly Board updates, and we also expect the system to assist:
- users in evaluating the health of the projects they’re consuming;
- project teams in assessing their own activity and momentum;
- member firms in determining the value they accrue via active participation in the community.
So with that said, how are the open source projects doing?
Let’s use Bitergia to look at the time period from May 1st 2016 (around the time we hosted the first project) through June 30th 2017.
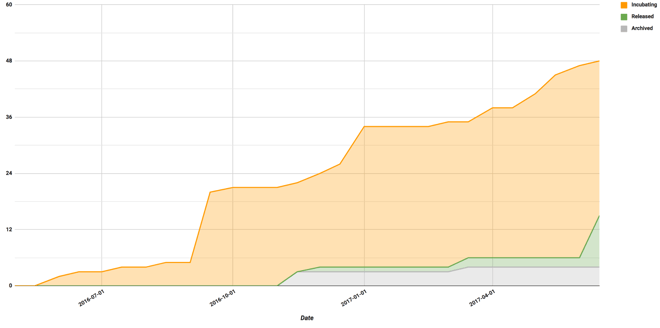
Figure 1 shows top-line project growth and maturity up to June 30th, 2017. As can be seen, we continue to have solid growth in project count and perhaps more importantly, more projects are maturing through the project lifecycle as well.

Figure 1 - Top-line Project Growth
Note: Bitergia does not capture project lifecycle state yet, so this graph was generated in a spreadsheet using a blend of data from Bitergia and elsewhere. We are working with Bitergia to add support for lifecycle state.
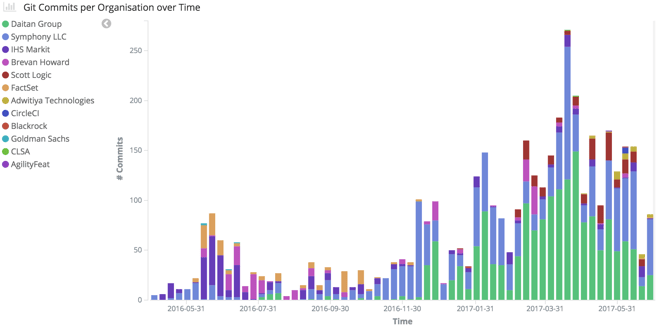
Figure 2 (from this Bitergia dashboard) shows commit activity over time by organisation. This graph clearly shows a large burst of activity, particularly on the part of Daitan Group (a Symphony LLC subcontractor), centred around the early April timeframe.

Figure 2 - Commit Activity per Organisation
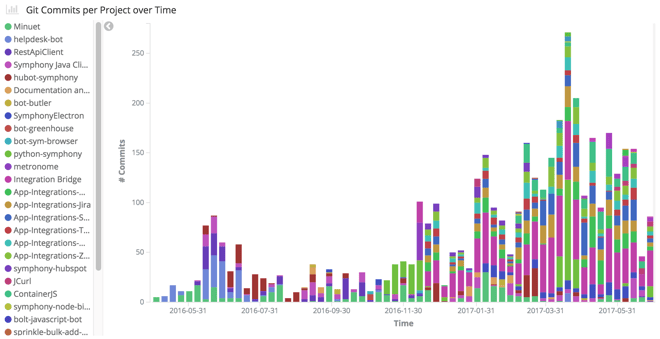
Figure 3 (from this Bitergia dashboard) shows commit activity over time, this time split by project, and with some further refinement we can explain the burst seen above: the commit activity in early April primarily occurred in the 7 integration projects (which were recently released by Symphony LLC). Presumably April was where the bulk of the development activity on these projects took place, ahead of that release.

Figure 3 - Commit Activity per Project
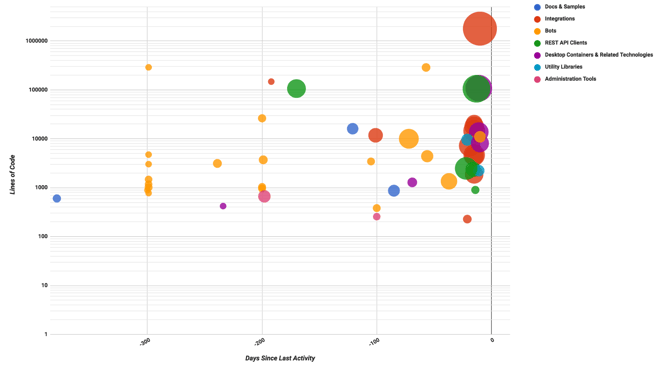
Finally, Bitergia makes it possible to construct multi-dimensional charts, such as that shown in Figure 4 (generated in a spreadsheet using raw data downloaded from this Bitergia dashboard - Bitergia doesn’t support bubble charts yet).
This chart captures project size (Y axis, logarithmic) vs “staleness” (days since last commit activity; X axis), while also showing relative commit activity (bubble size) and project “type” (colour).

Figure 4 - Project Summary Chart
From this chart we can see that most of our larger projects (which we can assume are functionally richer) are both fresh (have had recent activity) and more active (bubble size) - a good indicator of overall project portfolio health.
This chart also suggests areas where ESCo steering may be warranted - the vertical scatter of bots at around the 300 days old mark, for example, are likely moribund projects eligible for archiving. The REST API Client that’s approaching 200 days since last activity is another item that stands out - why hasn’t it had attention, especially in light of recent enhancements to the Symphony REST APIs?
In conclusion, the new metrics system we’ve launched can provide you, regardless of your level of participation in the community, with many valuable insights into the activity and momentum of the open source projects we host. Expanding this technology to other infrastructure in our project hosting environment (static code analysis, CI/CD, etc.), as well as to Working Groups, is a priority for us.
What would you like to see from this system?

.png)
